Self-Monitoring GreptimeDB Clusters
Before reading this document, ensure you understand how to deploy a GreptimeDB cluster on Kubernetes. This guide will walk you through configuring monitoring when deploying a GreptimeDB cluster.
Quick Start
You can enable monitoring and Grafana by adding configurations to the values.yaml file when deploying the GreptimeDB cluster using Helm Chart.
Here's a complete example of values.yaml for deploying a minimal GreptimeDB cluster with monitoring and Grafana:
image:
  registry: docker.io
  # Image repository:
  # Use `greptime/greptimedb` for OSS GreptimeDB
  # Consult staff for Enterprise GreptimeDB
  repository: <repository>
  # Image tag:
  # Use database version `v0.18.0-nightly-20250922` for OSS GreptimeDB
  # Consult staff for Enterprise GreptimeDB
  tag: <tag>
  pullSecrets: [ regcred ]

initializer:
  registry: docker.io
  repository: greptime/greptimedb-initializer

monitoring:
  # Enable monitoring
  enabled: true

grafana:
  # Enable Grafana deployment
  # Requires monitoring to be enabled first (monitoring.enabled: true)
  enabled: true

frontend:
  replicas: 1

meta:
  replicas: 1
  backendStorage:
    etcd:
      endpoints: "etcd.etcd-cluster.svc.cluster.local:2379"

datanode:
  replicas: 1
When monitoring is enabled, GreptimeDB Operator launches an additional GreptimeDB Standalone instance to collect metrics and logs from the GreptimeDB cluster. To collect log data, GreptimeDB Operator starts a Vector sidecar container in each Pod.
When Grafana is enabled, a Grafana instance is deployed that uses the GreptimeDB Standalone instance configured for cluster monitoring as its data source. This enables visualization of the GreptimeDB cluster's monitoring data out of the box using both Prometheus and MySQL protocols.
Then install the GreptimeDB cluster with the above values.yaml file:
helm upgrade --install mycluster \
  greptime/greptimedb-cluster \
  --values /path/to/values.yaml \
  -n default
After installation, you can check the Pod status of the GreptimeDB cluster:
kubectl -n default get pods
Expected Output
NAME                                 READY   STATUS    RESTARTS   AGE
mycluster-datanode-0                 2/2     Running   0          77s
mycluster-frontend-6ffdd549b-9s7gx   2/2     Running   0          66s
mycluster-grafana-675b64786-ktqps    1/1     Running   0          6m35s
mycluster-meta-58bc88b597-ppzvj      2/2     Running   0          86s
mycluster-monitor-standalone-0       1/1     Running   0          6m35s
You can then access the Grafana dashboard by port-forwarding the Grafana service to your local machine:
kubectl -n default port-forward svc/mycluster-grafana 18080:80
Then refer to the Access Grafana Dashboard section below for details on accessing Grafana.
Monitoring Configuration
This section covers the details of monitoring configurations.
Enable Monitoring
Add the following configuration to values.yaml to enable monitoring when deploying the GreptimeDB cluster:
monitoring:
  enabled: true
This deploys a GreptimeDB Standalone instance named ${cluster-name}-monitoring to collect metrics and logs. You can verify the deployment with:
kubectl get greptimedbstandalones.greptime.io ${cluster-name}-monitoring -n ${namespace}
The GreptimeDB Standalone instance exposes services using ${cluster-name}-monitoring-standalone as the Kubernetes Service name. You can use the following addresses to access monitoring data:
- Prometheus metrics:
http://${cluster-name}-monitor-standalone.${namespace}.svc.cluster.local:4000/v1/prometheus - SQL logs:
${cluster-name}-monitor-standalone.${namespace}.svc.cluster.local:4002. By default, cluster logs are stored in thepublic._gt_logstable.
Customize Monitoring Storage
By default, the GreptimeDB Standalone instance stores monitoring data using the Kubernetes default StorageClass in local storage.
You can configure the GreptimeDB Standalone instance through the monitoring.standalone field in values.yaml. For example, the following configuration uses S3 object storage to store monitoring data:
monitoring:
  enabled: true
  standalone:
    base:
     main:
       # Configure GreptimeDB Standalone instance image
       image: "greptime/greptimedb:latest"

       # Configure GreptimeDB Standalone instance resources
       resources:
         requests:
           cpu: "2"
           memory: "4Gi"
         limits:
           cpu: "2"
           memory: "4Gi"

    # Configure object storage for GreptimeDB Standalone instance
    objectStorage:
      s3:
        # Configure bucket
        bucket: "monitoring"
        # Configure region
        region: "ap-southeast-1"
        # Configure secret name
        secretName: "s3-credentials"
        # Configure root path
        root: "standalone-with-s3-data"
Customize Vector Sidecar
The Vector sidecar configuration for log collection can be customized via the monitoring.vector field.
For example, you can adjust the Vector image and resource limits as follows:
monitoring:
  enabled: true
  vector:
    # Configure Vector image registry
    registry: docker.io
    # Configure Vector image repository
    repository: timberio/vector
    # Configure Vector image tag
    tag: nightly-alpine

    # Configure Vector resources
    resources:
      requests:
        cpu: "50m"
        memory: "64Mi"
      limits:
        cpu: "50m"
        memory: "64Mi"
YAML Configuration with kubectl Deployment
If you're not using Helm Chart, you can also use the monitoring field to manually configure self-monitoring mode in the GreptimeDBCluster YAML:
monitoring:
  enabled: true
For detailed configuration options, refer to the GreptimeDBCluster API documentation.
Grafana Configuration
Enable Grafana
To enable Grafana deployment, add the following configuration to values.yaml.
Note that monitoring must be enabled first (monitoring.enabled: true):
grafana:
  enabled: true
Customize Grafana Data Sources
By default, Grafana uses mycluster and default as the cluster name and namespace to create data sources.
To monitor clusters with different names or namespaces, you need to create custom data source configurations based on the actual cluster names and namespaces.
Here's an example values.yaml configuration:
monitoring:
  enabled: true

grafana:
  enabled: true
  datasources:
    datasources.yaml:
      datasources:
        - name: greptimedb-metrics
          type: prometheus
          url: http://${cluster-name}-monitor-standalone.${namespace}.svc.cluster.local:4000/v1/prometheus
          access: proxy
          isDefault: true

        - name: greptimedb-logs
          type: mysql
          url: ${cluster-name}-monitor-standalone.${namespace}.svc.cluster.local:4002
          access: proxy
          database: public
This configuration creates the following data sources for GreptimeDB cluster monitoring in Grafana:
greptimedb-metrics: Cluster metrics stored in the standalone monitoring database, exposed via Prometheus protocol (type: prometheus)greptimedb-logs: Cluster logs stored in the standalone monitoring database, exposed via MySQL protocol (type: mysql). Uses thepublicdatabase by default
Access Grafana Dashboard
You can access the Grafana dashboard by port-forwarding the Grafana service to your local machine:
kubectl -n ${namespace} port-forward svc/${cluster-name}-grafana 18080:80
Then open http://localhost:18080 to access the Grafana dashboard.
The default login credentials for Grafana are:
- Username:
admin - Password:
gt-operator
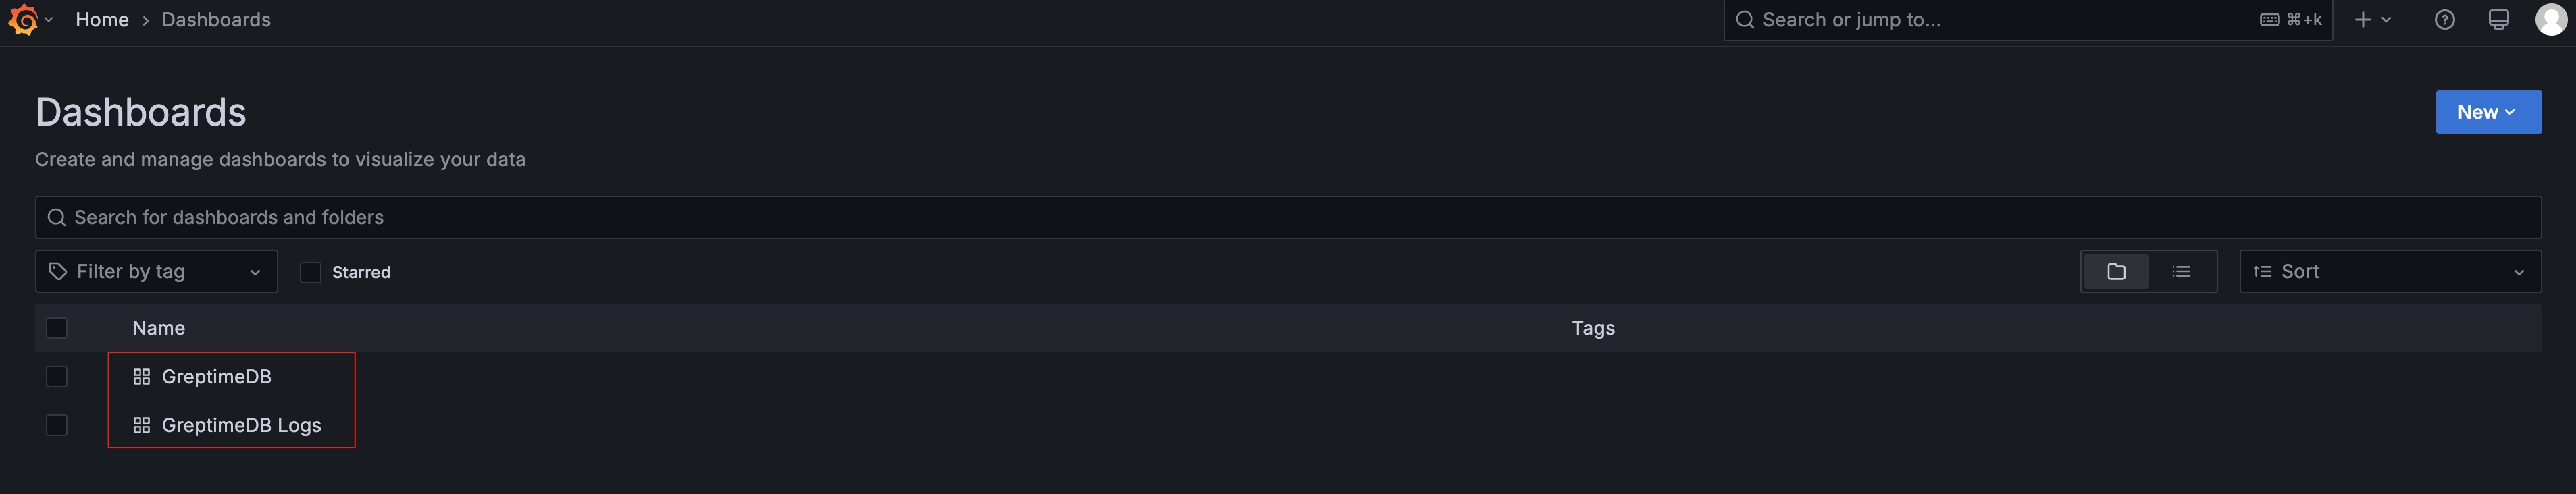
Navigate to the Dashboards section to explore the pre-configured dashboards for monitoring your GreptimeDB cluster.
Cleanup the PVCs
The cleanup operation will remove the metadata and data of the GreptimeDB cluster. Please make sure you have backed up the data before proceeding.
To uninstall the GreptimeDB cluster, please refer to the Cleanup GreptimeDB Cluster documentation.
To clean up the Persistent Volume Claims (PVCs) used by the GreptimeDB standalone monitoring instance, delete the PVCs using the following command:
kubectl -n default delete pvc -l app.greptime.io/component=${cluster-name}-monitor-standalone